Monday, May 30, 2011

Simple Diode Circuit

So, let's make a circuit with a diode! Now, diodes can have a bunch of characteristics when you buy them, so if you wanted to properly design a diode circuit, you'd need to know all the characteristics of the diode you bought. Also, to properly simulate, you need the same information.

So, I was interested in following the circuit simulation done in Sedra and Smith, so I googled for D1N4148, and found the following circuit model at http://www.seas.upenn.edu/~jan/spice/spice.models.html. Here is the model

.model D1N4148 D (IS=0.1PA, RS=16 CJO=2PF TT=12N BV=100 IBV=0.1PA)

I won't go over everything yet (want to keep this as concrete as possible for now), but the main take away is the the name of this model is D1N4148, as determined by the parameter right after the .model statement. You can paste this line at the beginning of your file, or you can, more nicely, put it into a separate file ("D1N4148.mod") .include statement, as shown below.


.include ~/spice_models/D1N4148.mod

vin 1 0 2.0
r1 1 2 5k
d1 2 0 D1N4148
.dc vin 0.0 1.0 .1
.plot dc v(1)
.end


Here, I have created saved the file in the directory spice_models located in my home directory.

So, launching spice we do the standard run


******
** ngspice-19 : Circuit level simulation program
** The U. C. Berkeley CAD Group
** Copyright 1985-1994, Regents of the University of California.
** Please submit bug-reports to: ngspice-bugs@lists.sourceforge.net
** Creation Date: Tue Feb 16 12:47:30 PST 2010
******

Circuit: *include ~/spice_models/D1N4148.mod

ngspice 213 ->
run
Doing analysis at TEMP = 27.000000 and TNOM = 27.000000

Warning: d1: breakdown current increased to 3.86635e-10 to resolve
Warning: incompatibility with specified saturation current
Reference value : 0.00000e+00

No. of Data Rows : 11


Cool We got a warning (which I will discuss some time in future), but aside from that, everything worked. Let's plot it.

ngspice 214 ->
plot v(1), v(2)


Now we might be initially surprised by this, if we thought that v(1) was the drop across the resistor. It's not, remember it's the voltage at node 1, so it's exactly whatever the voltage of the battery is. So we see as the voltage increases, the voltage drop across the diode eventually saturates to about 1 diode drop. However, let's go actually look at the voltage drop across the resistor


ngspice 215 ->
plot v(1)-v(2), v(2)


Ah! That looks right. However, that v(1)-v(2) title looks a bit ugly. We might want to do the following

ngspice 216 -> let resistorVoltage = v(1)-v(2)
ngspice 217 -> plot resistorVoltage, v(2)


Spiffy! So, we learned a lot just now. We learned how to include additional files using .include. We learned how to create variables using let, and we learned a little about model files. Yay!

Tuesday, April 12, 2011

RC Circuit

So, let's go create an RC circuit

RC Circuit
vin 1 0 1.0
r1 1 2 1MEG
c1 2 0 1uF
.ic V(1)=0 V(2)=0
.tran .001s 5s
.end

running in ngspice and plotting (plot v(1),v(2))we get


The new lines of note are the .ic and the .tran. .ic sets the initial conditions of all nodes. .tran sets the time step, and total time for the transient analysis. If you have both .dc and .tran in a single file, the last one is what will show up in an interpreter. If you do a batch run of course, both will be put into the result file.

Monday, April 11, 2011

Voltage Divider

So! Let's get started with a simple voltage divider. We have two resistors R1, and R2. We will hook them in series and attach across them some sort of battery. We will then attach a probe between them, and if luck holds out, this should give us a voltage drop of

R1/(R1+R2)

Lets see if this works.

So create a folder, and create a new text file (using vim in my case)

$ vim voltage_divider.spice

and enter the following spice language code into it

Voltage Divider
vin 1 0 1.0
r1 1 2 5K
r2 2 0 5K
.dc vin 0.0 1.0 .1
.plot dc v(1)
.end


Now, let's run spice

$ ngspice voltage_divider
******
** ngspice-19 : Circuit level simulation program
** The U. C. Berkeley CAD Group
** Copyright 1985-1994, Regents of the University of California.
** Please submit bug-reports to: ngspice-bugs@lists.sourceforge.net
** Creation Date: Tue Feb 16 12:47:30 PST 2010
******

Circuit: voltage divider

ngspice 118 -> run
Doing analysis at TEMP = 27.000000 and TNOM = 27.000000

Reference value : 0.00000e+00

No. of Data Rows : 11

ngspice 119 ->


So we've loaded the file, and we ran the analysis in it (the lines beginning with the '.'). We note that we don't see any graphs. However, if we type

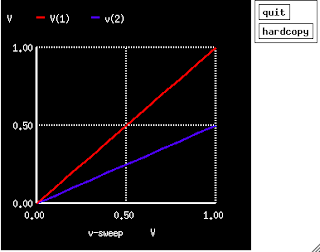
ngspice 119 -> plot V(1),V(2)

We get the following plot


Huzzah! The red line is the voltage across both resistors (Node 1), and the blue is the voltage across the second only (Node 2). We see that the blue line has half the slope of the red as expected.

If you're interested in measuring the voltage only across the first resistor rather than both, you can use

plot v(1)-v(2),v(1)

Learning Spice

Learning Spice is a webblog whose purpose is for me to learn the Spice Circuit Simulation Language. It is also intended to help people discover what pitfalls one might encounter when attempting to perform simple tasks.