R1/(R1+R2)
Lets see if this works.
So create a folder, and create a new text file (using vim in my case)
$ vim voltage_divider.spice
and enter the following spice language code into it
Voltage Divider
vin 1 0 1.0
r1 1 2 5K
r2 2 0 5K
.dc vin 0.0 1.0 .1
.plot dc v(1)
.end
Now, let's run spice
$  ngspice voltage_divider
******
** ngspice-19 : Circuit level simulation program
** The U. C. Berkeley CAD Group
** Copyright 1985-1994, Regents of the University of California.
** Please submit bug-reports to: ngspice-bugs@lists.sourceforge.net
** Creation Date: Tue Feb 16 12:47:30 PST 2010
******

Circuit: voltage divider

ngspice 118 -> run
Doing analysis at TEMP = 27.000000 and TNOM = 27.000000

Reference value :  0.00000e+00

No. of Data Rows : 11

ngspice 119 ->
So we've loaded the file, and we ran the analysis in it (the lines beginning with the '.'). We note that we don't see any graphs. However, if we type
ngspice 119 -> plot V(1),V(2)
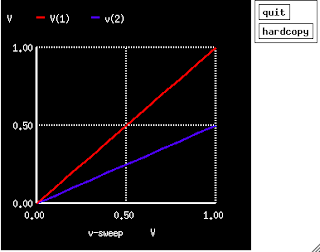
We get the following plot

Huzzah! The red line is the voltage across both resistors (Node 1), and the blue is the voltage across the second only (Node 2). We see that the blue line has half the slope of the red as expected.
If you're interested in measuring the voltage only across the first resistor rather than both, you can use
plot v(1)-v(2),v(1)
Attractive, post. I just stumbled upon your weblog and wanted to say that I have liked browsing your blog posts. After all, I will surely subscribe to your feed, and I hope you will write again soon! high voltage resistors
ReplyDelete